Mathematics Underlying the Physics First Curriculum
Click here for pdf (includes the document below, sample problems and a sample list of formulae used in Physics First)
Implications for 8th and 9th Grade Mathematics
by Dorina Mitrea
An ongoing collaboration between math and physics teachers is an integral part of a successful implementation of the Physics First curriculum. This summary is intended as the springboard for such a collaboration. The list below contains some examples from the Physics First curriculum which you, the mathematics teacher, may incorporate into your lessons and/or homework assignments for 8th and 9th grade.
1. Notation
Students need to understand that in a physics course the quantities measured in an experiment dictate the notation used for the independent and dependent variables.
- the letters x and y are NOT the letters generally used to label the horizontal and vertical axes in a physics class
While in most mathematics textbooks the letter x is used for the independent variable (represented on the horizontal axis) and the letter y is used for the dependent variable (represented on the vertical axis), this is not typically the case in the Physics First course. For example, in the study of uniform motion, time is an independent variable, denoted by t and represented on the horizontal axis, while position is a dependent variable, denoted by x and represented on the vertical axis. When sketching graphs, use often the terms independent variable/dependent variable and emphasize the fact that the actual symbols used for these variables do not affect the shape of the graph.
Word of caution: when using examples from Physics First in your mathematics class, make sure the terminology is the one students use in the physics class. For example, when discussing the motion of an object along a straight line, there is a clear distinction between distance traveled and change in position and between speed and velocity. The distance traveled is the total length traveled and is always positive, while change in position is the difference between the final position and the initial position, which may be negative. Speed is always positive while velocity may be positive or negative, the sign indicates the direction in which the motion takes place. - the subscripts used in Physics First are not always numerical
For example, vf and vi denote the final velocity and the initial velocity, respectively, as opposed to the v2 and v1 option that would be the preferred choice in a mathematics textbook. - there is a considerable use of the symbol Δ in Physics First to denote change
For example, if xi denotes the initial (or starting) position and xf denotes the final (or ending) position, then Δx = xf − xi denotes the change in position. Similarly, the time change from ti totf will be denoted by Δt = tf − ti.
2. Literal Formulas
- Use examples requiring students to substitute values into a given formula.
Example: Include examples with variables denoted by other letters than just x and y and whenever appropriate include formulas from the Physics First curriculum, such as: Evaluate3ma if m = 4 and a = 7.5. More examples
3. Literal equations
- Use examples requiring students to solve for one variable in terms of the others. A good resource is the list of formulas studied in the Physics First class.
4. Linear functions
- slope as a rate of change of the dependent variable with respect to the independent variable
Emphasize the computation and interpretation of the slope of a line as a rate of change of the dependent variable with respect to the independent variable, specifying units whenever possible. Include examples where the independent and dependent variables are denoted by other letters than x and y.
- changing the scale on the dependent/independent axis manipulates the graph’s appearance
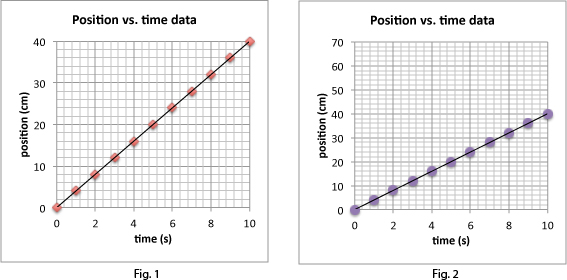
Give a few examples to show that changing the scale on the dependent axis manipulates the graph’s appearance, making the slope of the graph of a linear function appear to be greater or lesser than before the manipulation. As such, if the slopes of the graphs of two linear functions are to be compared only by looking at their graphs, the scales used for the two functions should be the same. This also shows the importance of using units of measure for the variables involved. Examples are shown in Figs. 1 and 2 below, where the values of the slopes in both figures are the same, even though the line in Fig. 1 looks steeper because of the scale of the vertical axis.

- linear functions = functions for which the rate of change over any interval is a constant
Stress the fact that linear functions are precisely those functions for which the rate of change over any interval is a constant which does not change from one interval to another. Help students make the connection between constant ratios and linear relationships.
- uniform motion
Uniform motion problems typically involve something traveling at some fixed and steady (uniform) pace (rate or speed) and the main governing formula is d = st, where d stands for distance (position), s stands for the (constant or average) speed, and t stands for time. As such, examples in the spirit of the ones in the Uniform Motion unit are well suited when discussing linear functions.
5. Piecewise linear functions.
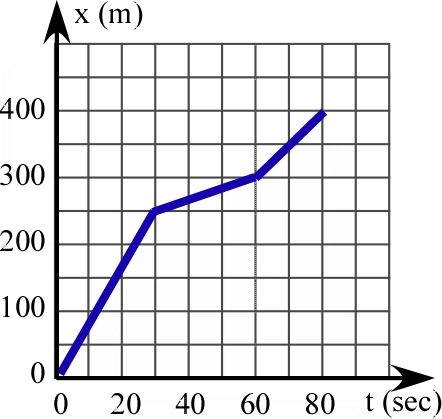
- Expose students to examples of motion (of a car, of a bicycle, etc.) depicted by piecewise linear graphs (“broken” lines). Use t (time) as the independent variable and x (position) as the dependent variables, each with appropriate units of measure. (More examples)

6. Quadratic functions.
- provide students with an introduction to quadratic functions and their graphs (parabolas) as a
first-semester topic in Algebra I
Provide students with an introduction to quadratic functions and their graphs (parabolas) as a first-semester topic in Algebra I without solving quadratic equations based on the quadratic formula or factoring (this is a topic that will likely be covered during the second semester; see the problems listed below to be used after you discuss solving quadratic equations). - include evaluating quadratic expressions
For example, have them evaluate y = 5x2 for x = 0, x = 2, x = 3 and graph parabolas using calculators. - include the uniform accelerated motion under gravity (free fall)
After covering the quadratic formula and factoring, you can use problems related to uniform accelerated motions under gravity (free fall). (More examples)
7. Solving systems of equations.
- introduce systems of equations as a second-semester topic
In addition to solving the equation 2x−6 = 4−x (sometimes referred to as “solving simultaneous quations”) using symbol manipulation, consider having students graph the lines y1 = 2x − 6and y2 = 4 − x and decide if the two lines intersect. Emphasize the connection between the solution for the original equation and the x coordinate of the intersection point of the two lines. - use the trace feature of a graphing calculator to estimate the point of intersection of two given
lines
Explore finding approximate solutions to systems of equations using the trace feature of graphing calculator to estimate the point of intersection of two given lines. Use the intersect function if available on your calculator to compute exact solutions.
8. Area
- area of polygonal shapes
When determining the area of geometric figures, include examples of polygonal shapes for which the students do not have a direct area formula but which can be partition into familiar shapes (e.g., triangles, rectangles), find the areas of each partition, and sum the areas to get the total area.
- area of the region under the graph of a piecewise linear function
Include a few in-class or homework problems in which students have to compute the area of the region under the graph of a piecewise linear function.
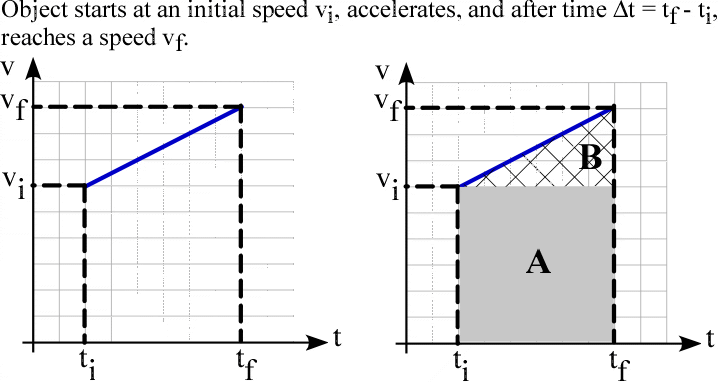
An example is shown in Fig. 4 below. The area under a velocity-time graph gives the displacement of the object. Thus the displacement in the time interval between ti and tf is given by the area under the blue line. That area is the sum of the area of the rectangle A and the triangle B.

9. Measurement
- the metric system
Introduce elements of the metric system early in the school year, especially units of length (e.g., km, m, cm, mm). - unit conversion
Provide several examples of unit conversions. Include problems in which the data given is not all in the same units of measure (e.g., if the speed of a cyclist is 2 meters per second, how long will it take her to cover 1 kilometer?). Require students to include the unit of measure in every step when solving a problem that involves quantities given in units of measure.
10. Number and Operation
- include decimal numbers in examples and problems
For example, include the computation of the quotient of two decimal numbers in computing the slope of a line or evaluating algebraic expressions for decimal values. - Encourage proportional reasoning by including appropriate problems as you cover various
topics.
